Deep learning models keep evolving. They are becoming huge and complex. Researchers find new architectures usually by combiniating existing operators of Tensorflow or PyTorch because researches require many trial and errors. However, sometimes, we may need a custom op for more optimizations. As the size of deep learning models grows, it will be more important to have optimized operators for production or scalable training. Thus, I studied how to write a custom layer in CUDA. I’ll share my approach to optimize my Transformer model I implemented last time, from profiling to writing a PyTorch op in CUDA.
Profiling
First, we have to be familiar with profiling of a deep learning model so that we can find a bottleneck and see how much improvement we have made after optimization. We can use the built-in PyTorch profiler, or general python profilers. We’ll take a look at both approaches.
torch.autograd.profiler
PyTorch provides an API, torch.autograd.profiler. We can use the api like this:
with torch.autograd.profiler.profile(use_cuda=True) as prof:
    # Execute ops here
print(prof)
Then, PyTorch automatically hooks each operator and measures performance of them. The profile result looks like this:
-------------  -----------  -----------  ------  -----------  -----------
Name              CPU time    CUDA time   Calls    CPU total   CUDA total
-------------  -----------  -----------  ------  -----------  -----------
eq               167.070us    166.944us       1    167.070us    166.944us
_th_eq           142.247us    144.416us       1    142.247us    144.416us
unsqueeze         35.181us     35.008us       1     35.181us     35.008us
triu              48.451us     48.000us       1     48.451us     48.000us
unsqueeze          3.987us      4.000us       1      3.987us      4.000us
embedding        520.553us    552.928us       1    520.553us    552.928us
squeeze           10.234us     10.240us       1     10.234us     10.240us
unsqueeze          3.535us      3.456us       1      3.535us      3.456us
masked_fill_      48.311us     78.656us       1     48.311us     78.656us
...
The profiler shows the time spent on CPU and GPU for each operator. It’s straightforward and seems
like precise, but it’s not easy for me to distinguish ops and match them with my source code. For
example, the above output shows three different unsqueeze operators, but we don’t know where they
are called from. Thus, I moved to other profilers to find a bottleneck point.
line profiler
Since PyTorch is pythonic, we can also use general python profilers. I found line
profiler which profiles a python application line by line.
I could simply run the profiler by replacing python with kernprof in command line after adding a
@profiler decorator on the top of a function you want to profile. In addition, for the case of
CUDA, we have to set an environment variable CUDA_LAUNCH_BLOCKING to make CUDA calls synchronous.
$ CUDA_LAUNCH_BLOCKING=1 kernprof -lv train.py --problem lm1b --output_dir ./output --data_dir ./lm1b_data --model transformer

...

Line #      Hits         Time  Per Hit   % Time  Line Contents
==============================================================
    60                                               @profile
    61                                               def forward(self, q, k, v, mask, cache=None):
    ...
    69     13104    4009741.0    306.0     12.4          q = self.linear_q(q).view(batch_size, -1, self.head_size, d_k)
    ...
    73     13104    3630059.0    277.0     11.2              k = self.linear_k(k).view(batch_size, -1, self.head_size, d_k)
    74     13104    3600372.0    274.8     11.2              v = self.linear_v(v).view(batch_size, -1, self.head_size, d_v)
    ...
    83                                                   # Scaled Dot-Product Attention.
    84                                                   # Attention(Q, K, V) = softmax((QK^T)/sqrt(d_k))V
    85     13104    2323423.0    177.3      7.2          q.mul_(self.scale)
    86     13104    4916371.0    375.2     15.2          x = torch.matmul(q, k)  # [b, h, q_len, k_len]
    87     13104    1894378.0    144.6      5.9          x.add_(torch.zeros_like(x).masked_fill_(mask.unsqueeze(1), -1e9))
    88     13104    1948069.0    148.7      6.0          x = torch.softmax(x, dim=3)
    89     13104    1209843.0     92.3      3.7          x = self.att_dropout(x)
    90     13104    3235607.0    246.9     10.0          x = x.matmul(v)  # [b, h, q_len, attn]
    ...
    95     13104    3719383.0    283.8     11.5          x = self.output_layer(x)
    ...
Result of profiling MultiHeadAttention forward function after running an epoch looks like the above. It shows measured time spent for each line, so we can easily find a target code to optimize. Let’s focus on masked operations in line 85, 87 and 88. It’s combinating multiple operators to mimic “masked softmax” operation: filling negative infinite numbers to masked inputs of softmax so that softmax ignores them. In this post, I’ll try to optimize these operations. Note that it’s currently spending 19.1% (7.2 + 5.9 + 6.0) of the function execution time while line 86 is spending 15.2% of the time. Let’s use this value as a baseline.
There are also another good points for optimization, matrix multiplications in line 86 and 90, because their input or output are filled with a lot of zeros. But, I’ll not cover them at this time.
Masked Softmax
First, I thought we can optimize the masked softmax just by putting them together into a single operator because executing multiple operators itself makes an overhead. At every time calling each seprate operator, CUDA kernel calls make overhead and it also needs data transfer time between host and GPU.
I’ll make a custom CUDA operator named MaskedSoftmax. I’ll briefly define what it is.
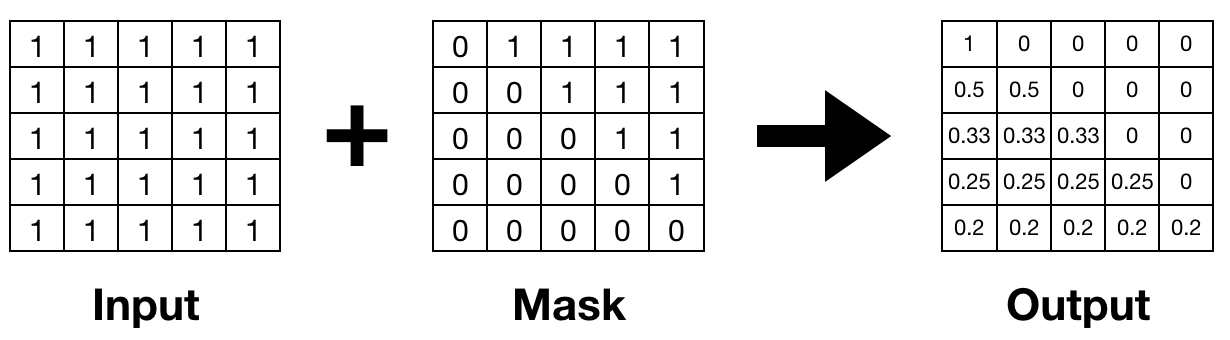
\(x\) is an input tensor of softmax, \(m\) stands for a mask tensor, and \(s\) is a scalar value of scale. The equation is similar with softmax except that masked values are treated as zero and multiplies input by a scale. The following figure shows an example of MaskedSoftmax. Masked positions become zero, and softmax is applied to the rest of values.
First Version
I first wrote a simple version of MaskedSoftmax. It consists of three passes that have the same flow with softmax: 1) find a maximum value of an input, 2) calcuate a sum of exponential values, and 3) make a exponential of each value and divide them by the sum of exponential values. The difference with softmax is that it also loads mask values and converts each input value to zero if their mask value is one.
template <typename scalar_t>
__global__ void __launch_bounds__(32) masked_softmax_cuda_forward_kernel(
    const scalar_t* __restrict__ input,
    const scalar_t* __restrict__ mask,
    scalar_t* __restrict__ output,
    unsigned int hidden_size,
    unsigned int m0, // size of mask dimension 0
    unsigned int m1, // size of mask dimension 1
    unsigned int m2, // size of mask dimension 2
    scalar_t scale) {

  // This threadIdx.x is a number between 0 and 31 because we only launched 32 threads.
  const int tid = threadIdx.x;
  // blockIdx.x, y, z are offsets of 0th, 1st, 2nd dimensions of input tensor.
  const unsigned int ibase = blockIdx.x * gridDim.y * gridDim.z * hidden_size +
                             blockIdx.y * gridDim.z * hidden_size +
                             blockIdx.z * hidden_size;
  const unsigned int mbase = blockIdx.x * (m0 > 1 ? m1 * m2 * hidden_size : 0) +
                             blockIdx.y * (m1 > 1 ? m2 * hidden_size : 0) +
                             blockIdx.z * (m2 > 1 ? hidden_size : 0);
  unsigned shfl_mask = __ballot_sync(0xffffffff, threadIdx.x < hidden_size);

  // Find a maximum input.
  scalar_t max_x = -FLT_MAX;
  for (unsigned int i = tid; i < hidden_size; i+=blockDim.x) {
    scalar_t m = mask[mbase + i];
    max_x = fmaxf(max_x, m == 0 ? input[ibase + i] * scale : -FLT_MAX);
  }
  // Reduce values in threads to find a global maximum number.
  for (unsigned int i = 16; i > 0; i >>= 1) {
    max_x = max(max_x, __shfl_xor_sync(shfl_mask, max_x, i));
  }

  // Find a sum of exponential inputs.
  scalar_t exp_sum = 0;
  for (unsigned int i = tid; i < hidden_size; i+=blockDim.x) {
    scalar_t m = mask[mbase + i];
    exp_sum += m == 0 ? std::exp(input[ibase + i] * scale - max_x) : 0;
  }
  // Reduce values in threads to find a global summation of exponential inputs.
  for (unsigned int i = 16; i > 0; i >>= 1) {
    exp_sum += __shfl_xor_sync(shfl_mask, exp_sum, i);
  }

  // Calculate outputs and save to global memory.
  for (unsigned int i = tid; i < hidden_size; i+=blockDim.x) {
    scalar_t m = mask[mbase + i];
    output[ibase + i] = m == 0 ? std::exp(input[ibase + i] * scale - max_x) / exp_sum : 0;
  }
}
CUDA has a concept of warp and block. Warp is a group of 32 threads, and a block has multiple warps. Each block has a shared memory, and there is a global memory accessible by any thread. Each thread executes the same kernel code with different thread and block id, thus each kernel finds and reads relevant input using the ids in global memory, and also saves each output to global memory. Since computation is distributed, it may need to reduce values in different blocks or threads if necessary.
In this softmax implementation, we need a reduction to get a sum or maximum of values. Since memory accesses to global/shared memory are common bottlenecks in CUDA kernel, I tried to avoid it. To do so, I created a single warp for each block, and used shuffle function. It uses registers for intra-warp communication, so threads can excahnge values without accessing shared memory.
for (unsigned int i = 16; i > 0; i >>= 1) {
  max_x = max(max_x, __shfl_xor_sync(shfl_mask, max_x, i));
}
With this custom operator, the time ratio of the masked softmax is reduced to about 15%. It’s not a huge improvement, but anyway it’s faster than before.
Line #      Hits         Time  Per Hit   % Time  Line Contents
==============================================================
    ...
    82                                                   # Scaled Dot-Product Attention.
    83                                                   # Attention(Q, K, V) = softmax((QK^T)/sqrt(d_k))V
    84     13048    4926927.0    377.6     16.2          x = torch.matmul(q, k)  # [b, h, q_len, k_len]
    85     13047    4462557.0    342.0     14.7          x = MaskedSoftmax.apply(x, mask, self.scale)
    ...
Now the built-in pytorch profiler shows the peroformance of this custom operator. So, I used this as a new baseline for further optimizaiton because line profiler took too much time to profile.
...
MaskedSoftmax          659.380us  733.185us   1   659.380us   733.185us
MaskedSoftmax          224.382us  241.669us   1   224.382us   241.669us
...
MaskedSoftmaxBackward  183.394us  126.968us   1   183.394us   126.968us
...
Further optimization
As I mentioned, memory accesses to global memory is a main bottleneck. We can minimize the number of memory accesses if we have some assumptions. The first version is currently reading two kinds of values, mask and input, from global memory. Masks used for the scaled dot-product attention usually have the following forms.
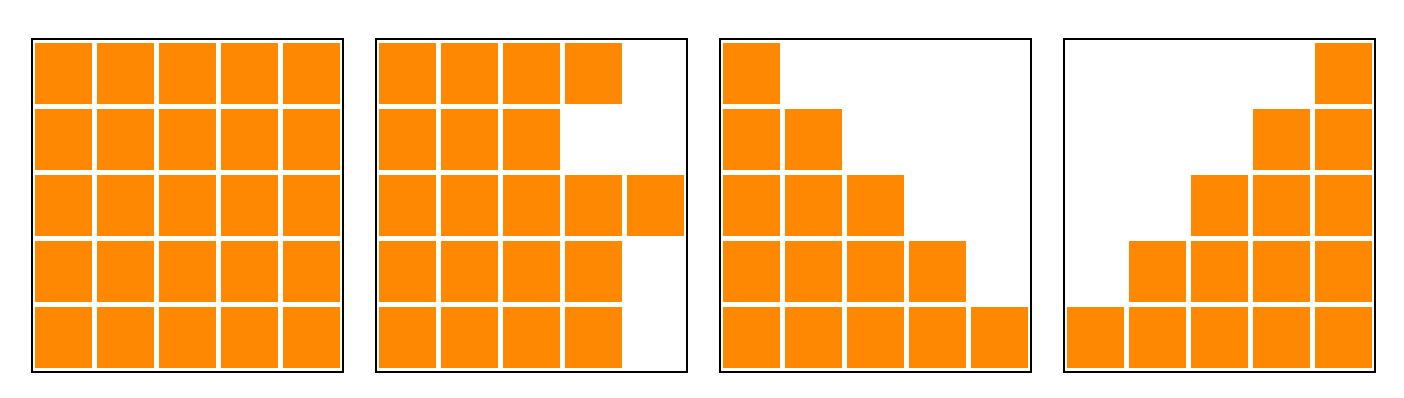
They are consecutive starting from leftmost or rightmost, and vanilla Transformer has only left three forms that are starting from leftmost. Thus, we don’t need to load a mask value for each input. It’s sufficient to load a single value indicating mask lengths before reading each row.
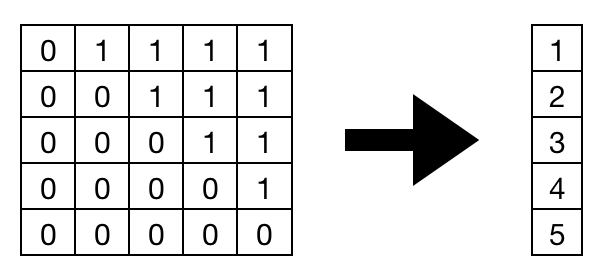
We can simply convert masks into a new form with this code:
mask = mask.size(2) - mask.sum(dim=2, dtype=torch.int32)
Then, we just need to load the mask lengths at first, iterate each loop as much as the mask length, and set zero for rest of the outputs.
  // Load a mask length.
  const unsigned int mask_offset = blockIdx.x * (m0 > 1 ? m1 : 0) +
                                   blockIdx.z * (m1 > 1 ? 1 : 0);
  unsigned int mask_size = min(static_cast<unsigned int>(mask[mask_offset]),
                               hidden_size);

  unsigned shfl_mask = __ballot_sync(0xffffffff, threadIdx.x < mask_size);

  scalar_t max_x = -FLT_MAX;
  // Iterate loop as much as the mask length.
  for (unsigned int i = tid; i < mask_size; i+=blockDim.x) {
    max_x = fmaxf(max_x, input[ibase + i] * scale);
  }
  for (unsigned int i = 16; i > 0; i >>= 1) {
    max_x = max(max_x, __shfl_xor_sync(shfl_mask, max_x, i));
  }

  scalar_t exp_sum = 0;
  for (unsigned int i = tid; i < mask_size; i+=blockDim.x) {
    exp_sum += std::exp(input[ibase + i] * scale - max_x);
  }
  for (unsigned int i = 16; i > 0; i >>= 1) {
    exp_sum += __shfl_xor_sync(shfl_mask, exp_sum, i);
  }

  // We initialized "output" to zero, so remaining outputs will be zero.
  for (unsigned int i = tid; i < mask_size; i+=blockDim.x) {
    output[ibase + i] = std::exp(input[ibase + i] * scale - max_x) / exp_sum;
  }
With this change, it becomes much faster. it’s now only spending 9% of the function time.
Line #      Hits         Time  Per Hit   % Time  Line Contents
==============================================================
    ...
    84     13007    5011658.0    385.3     17.2          x = torch.matmul(q, k)  # [b, h, q_len, k_len]
    85     13007    2688885.0    206.7      9.2          x = MaskedSoftmax.apply(x, mask, self.scale)
    ...
The execution time of MaskedSoftmax forward is now 2.5x faster than the first version.
MaskedSoftmax          716.706us  628.830us   1   716.706us   628.830us
MaskedSoftmax          261.741us   87.044us   1   261.741us    87.044us
...
MaskedSoftmaxBackward  171.726us   79.880us   1   171.726us    79.880us
...
I also checked how much this optimization makes entire training faster. I ran language model trainings on lm1b dataset, and measured average time for each (shard) epoch. The first CUDA version is about 0.8% faster than combinating PyTorch operators, and the second version is about 1.8% faster than the original version.
| Original | First Version | Second Version | |
|---|---|---|---|
| Min | 441.05 sec | 436.66 sec | 433.61 sec |
| Max | 442.20 sec | 439.70 sec | 435.29 sec |
| Avg | 441.67 sec | 438.08 sec (0.8%) | 433.90 sec (1.8%) |
Conclusion
I wrote a custom operator in CUDA and made Transformer training about 2% faster. I first expected a huge performance improvement just by rewriting an operator in CUDA, but it was not. There are a lot of factors affecting performance, but I couldn’t catch everything. Besides, I encountered a lot of bugs because I’m not familiar with CUDA, and more code makes more bugs. This also makes me to write a lot of unexpected test code. This is a trade-off between performance and time to write code.
Writing a custom op was not as simple as I thought, but I could learn many things about how CUDA works and basic concepts like block, thread, kernel, memory, synchronization, and cache. I hope this helps people who starts performance optimization with CUDA.
You can find the full code in https://github.com/tunz/tcop-pytorch and an usage in https://github.com/tunz/transformer-pytorch.